The increasing availability of building system trend data is allowing for an ever-clearer picture of what really is going on in system operation.
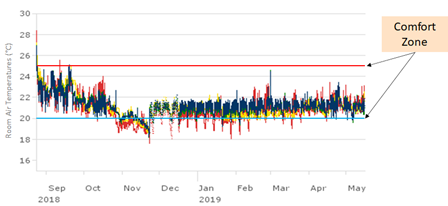
We were tracking the operation of a new grade school in the first year after completion, which included verifying that room temperatures remained in a comfortable range. Our evaluations were based on a review of system trend data, which was a good thing because we noticed an issue that we wouldn’t have if we were instead doing spot testing. Room temperatures were steadily falling as the seasons progressed toward winter. Going into November, they were starting to fall below the comfort range (20°C or 68°F).
If we had been taking spot measurements, we may have noticed that the values were slightly below the comfort range but may have chalked that up to local fluctuations in the rooms, weather conditions, etc. However, the data showed a consistent downward trend.
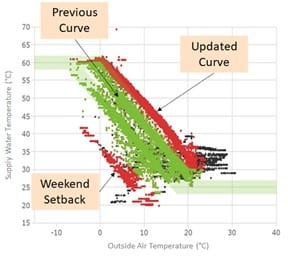
We looked at the heating hot water system. Was the temperature falling below the setpoint? Control for this system is based on outside air temperature–the colder it is outside, the higher the supply water temperature is set. The data showed that the temperature was following the setpoint curve nicely. Therefore, the conclusion was to adjust the setpoint curve–increasing the temperature provided by the system. The results also proved clear, consistent, and comfortable temperatures. Building trend data for the win!